An award-winning all-in-one Java profiler
JProfiler is an award-winning all-in-one Java profiler. JProfiler's intuitive GUI helps you find performance bottlenecks, pin down memory leaks and resolve threading issues.
Exceptional ease of use
When you profile, you need the most powerful tool you can get. At the same time, you do not want to spend time learning how to use the tool. JProfiler is just that: simple and powerful at the same time.
Configuring sessions is straight-forward, third party integrations make getting started a breeze and profiling data is presented in a natural way. On all levels, JProfiler has been carefully designed to help you get started with solving your problems.
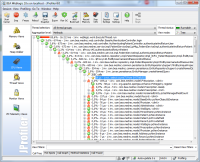
Real-time display of profiling data
With JProfiler you can immediately observe profiling data as your application is running. CPU, memory and thread profiling views are updated live and can be inspected without the need to wait for the measurement to complete.
For a large number of use-cases, this ability provides you with an extremely fast path to a solution. In addition, you can save snapshots at any time, interactively as well as programmatically.
The unique heap walker
Finding a memory leak can be impossible without the right tool. JProfiler's heap walker offers you an intuitive interface to solve both simple and complex memory problems. 5 different views show different aspects of the current set of objects.
Each view allows you to create new object sets based on the displayed data. Each view provides you with essential insights on the selected objects. Questions like why objects are not garbage collected are answered with a single click of the mouse.
The powerful CPU profiler
Fixing performance bottlenecks is the most frequent use case for a profiler. However, CPU data can be overwhelming in its level of detail and the way data is collected can make a huge difference in usability.
With JProfiler, you have a decisive advantage when trying to find the reason for a problem. Call tree view filters, aggregation levels and thread status selectors are just some examples of JProfiler's versatility in this area.
The integrated thread profiler
Problems related to threading are much more frequent than one might assume. Without a thread profiler, you only have a minimal chance to tackle such issues.
A whole range of otherwise opaque problems can be solved when using JProfiler, such as increasing liveness in a multi-threaded application that uses too much locking. Thread profiling not only has a separate view section in JProfiler, it is also tightly integrated into the CPU profiling views.
Excellent support for Java Enterprise Edition
Dedicated support for JEE is present in most views in JProfiler. For example, in the JEE aggregation level you see the call tree in terms of the JEE components in your application.
Also, JProfiler adds a semantic layer on top of the low-level profiling data, like JDBC, JMS and JNDI calls that are presented in the CPU profiling views. With its JEE support, JProfiler bridges the gap between a code profiler and a high-level JEE monitoring tool.
Extensive QA capabilities
JProfiler is ideally suited as a QA tool, both during development as well as for dedicated QA teams. The rich functionality around snapshot comparisons makes it easy to track progress. JProfiler has strong support for command line operations.
This includes the ability to profile, export snapshot data and create snapshots comparisons from the command line. The ant tasks bundled with JProfiler allow you to perform all command line operations from your build script.
Broadest support for platforms, IDEs and application servers
JProfiler integrates into your environment: We provide native agent libraries for a wide range of platforms, both for 32-bit and 64-bit JVMs. Integrations into all popular IDEs makes profiling during development as easy as running your application.
And the large number of integrations wizards for nearly all application servers on the market ensures that you can get started with a few clicks and not with reading documentation.
Low overhead
JProfiler records data only when you need it. In fact, you can start your application with the JProfiler agent and attach the JProfiler GUI at a later time. When you do not record any data, the overhead is extremely small. That's what we call on demand profiling.
Invariably, there are a lot of things you can adjust in an advanced profiler. JProfiler shows you how your profiling settings will impact performance and offers you templates to quickly select profiling settings for common use cases.
Extensibility
JProfiler is extensible. It is built on a well-documented platform that allows you to build your own custom profiler for special situations or your own analysis tool for snapshots.
With the interceptor API you can add additional semantic layers to the profiling data, similar to the built-in JDBC, JMS and JNDI profiling. The ready-to-run examples show you how easy it is to extend JProfiler with a few lines of code.
NOTE:
Users will be required a trial license key that can be requested here.
Requirements:
• Java
Operating system:Windows XP / Vista / 7 / 8 / 8 64 bit / 2003 / 2008 / Server 2012 / 10 / 10 64 bit

Learn to hack ethically
Price: $0, Rating: 9.39, Downloads: 396
Download

This ASP component enables file downloads to be controlled from within a script. It allows for password protection of individual files, and for record keeping. A built in access code generator is included. There are also some file utility functions.
Price: $35, Rating: 1, Downloads: 289
Download
With TreeBase Generator you will receive a MS Windows based application. It was tested on Win 98, ME and 2000. TreeBase Generator will create a new database for you and will also generate a complete w
Price: $ 79, Rating: 10, Downloads: 237
Download
Finds and erases confidential information.
Price: $ 29.95, Rating: 9, Downloads: 224
Download
QueryShark is an easy to use, agent-less tool to collect system information from your network of Windows based computers.
Price: $ 295, Rating: 10, Downloads: 173
Download